Search:
Per 100,000 population and week. Week ending on (2022-04-06).
Per 100,000 population and week. Week ending on (2022-04-13).
Per 100,000 population and week. Week ending on (2022-04-20).
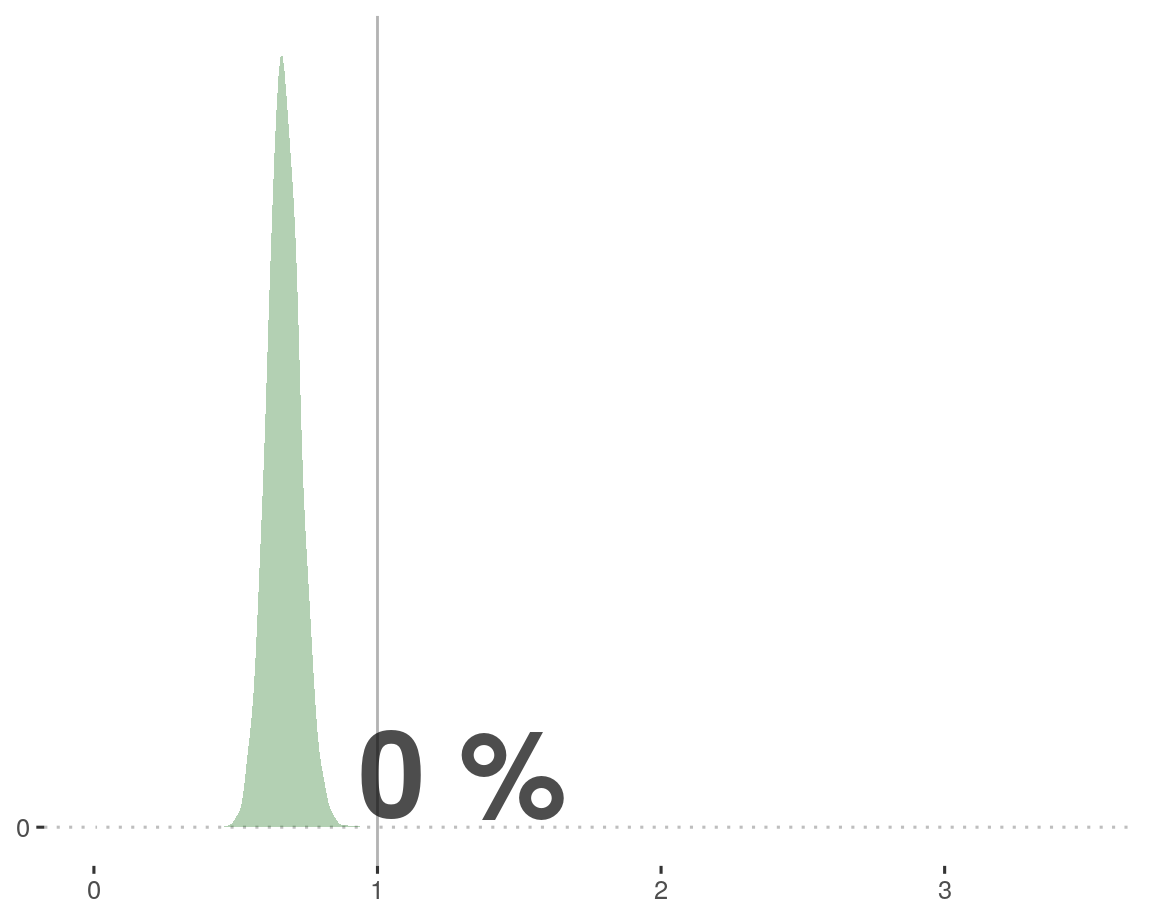
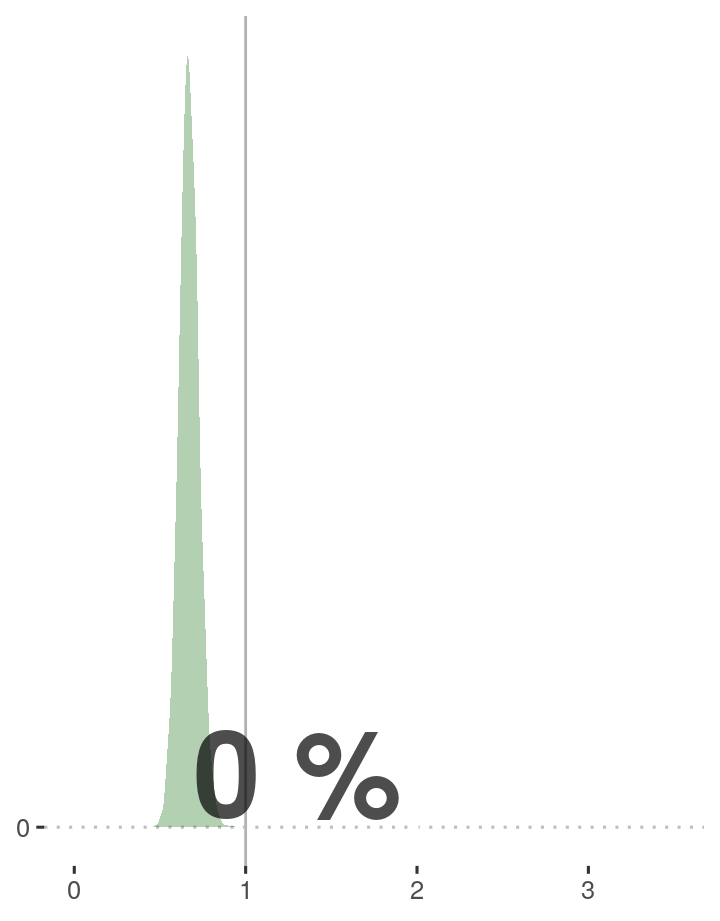
Time-Varying Reproduction Number Rt with uncertainty bands. Vertical line: last day of data included in the model (2022-03-30).
Weekly reported cases per 100,000 population; Red bars: reported cases in a given week; Bands: Fitted/predicted value in the model; Vertical line: last day of data included in the model (2022-03-30).
Bands: Weekly estimated infections per 100,000 population; Vertical line: last day of data included in the model (2022-03-30).
Weekly reported deaths per 100,000 population; Red bars: reported deaths in a given week;
Bands: Fitted/predicted value in the model; Vertical line: last day of data included in the model (2022-03-30).
Model run performed at: Sat Apr 2 06:12:52 2022
Output version: 20220401-201030